WHAT IS A qEEG
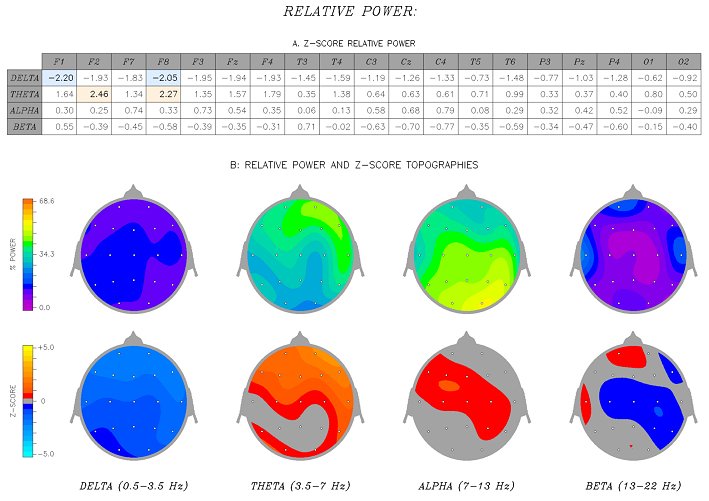
qEEG stands for quantitative electroencephalograph. Brainwave activity is recorded non-invasively from a 19-Channel cap that the client wears for about 30 minutes. The resulting EEG data are computer processed to provide a statistical analysis of brain electrical activity. In turn, these data are presented in various visual forms such as “brain maps”, statistics and other images which can show the ways in which different areas of the brain are functioning.
The use of a normative database allows for a precise determination of whether brain functioning falls within a “normal” pattern for a persons age, sex, and handedness, or whether there is some other type of functioning which might need clinical attention. Perhaps, the most important use of the qEEG is to provide a guide for Neurofeedback training which can help to correct abnormal brain functioning.
The 19-Channel qEEG is the gold standard evaluation for Neurofeedback.
Notice Regarding Brain Studies
Among many clinicians, there is widespread agreement that attention deficit disorder (ADD) is a problem related to the way the brain is functioning. Moreover, ADD is not a single disorder. Instead, there are various symptoms of ADD, each of which is reflected in different patterns of brain activity.
Health Psychology is unique in providing advanced, state-of-the-art brain activity studies. These are done with computerized EEG analysis known as Quantitative EEG/qEEG. Such studies are so valuable that it is our clinic’s policy not to enter into a Neurofeedback Training Program without them. This is our way of insisting upon utilizing the best methodology available.
A qEEG Brain Map/19 Channel Quantitative Electroencephalogram is the gold standard of the neurofeedback field for evaluation; leading to the most precise neurofeedback training protocols.
qEEG RECORDING
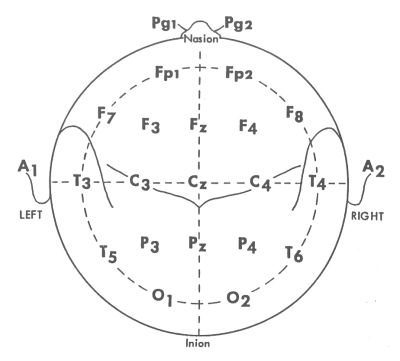
Diagram showing electrode placements according to the 10-20 international system. Each of these sites is used to record a 19 channel EEG for conversion into a quantitative EEG (See What is a QEEG?). This view of the head shows the back of the head on the bottom and the nose at the top, right, and left are the ears.
ADHD AND LEARNING DISABILITY
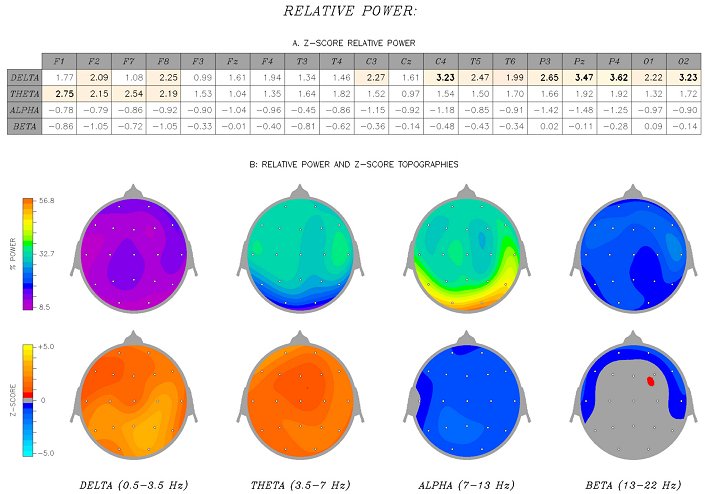
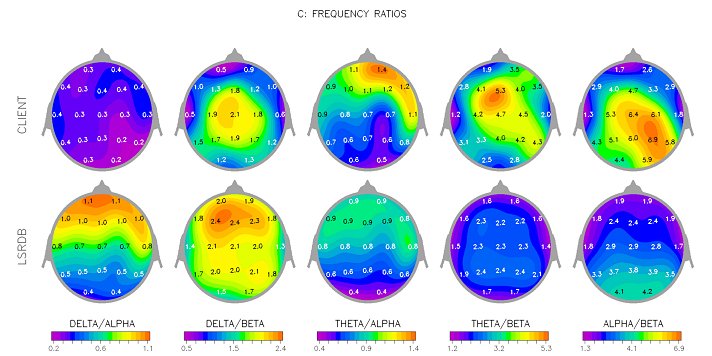
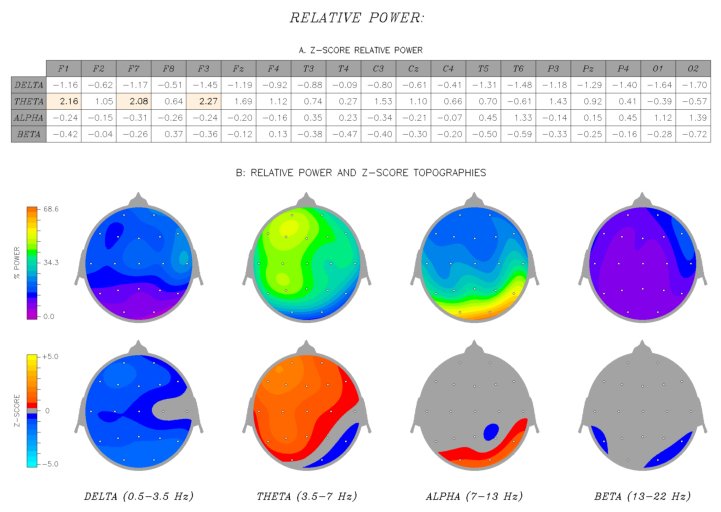
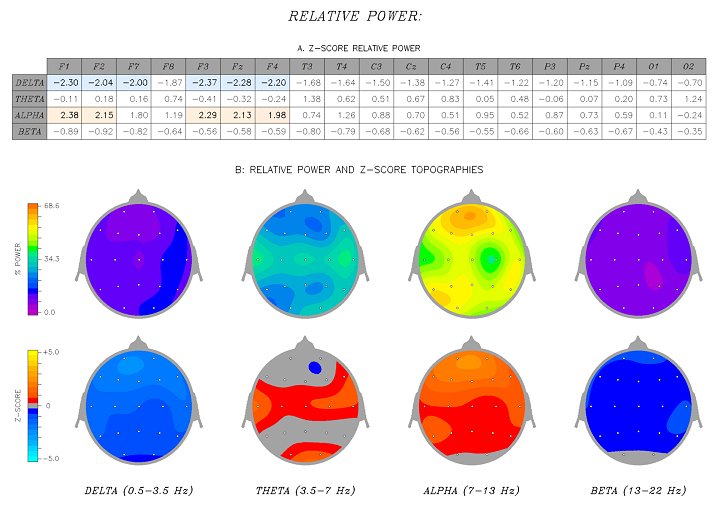
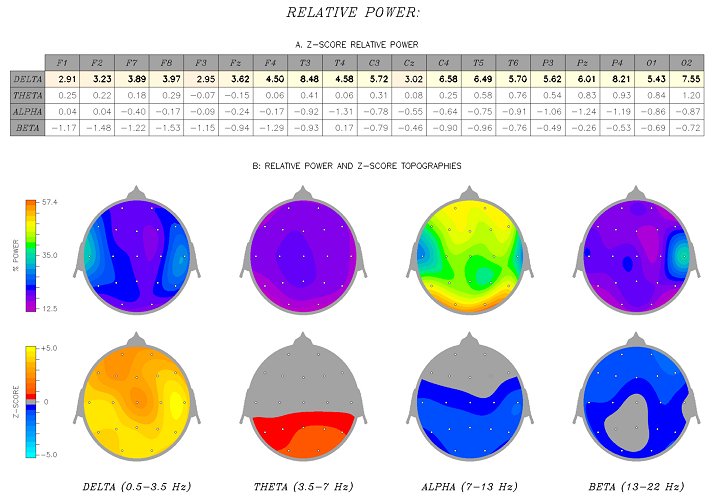
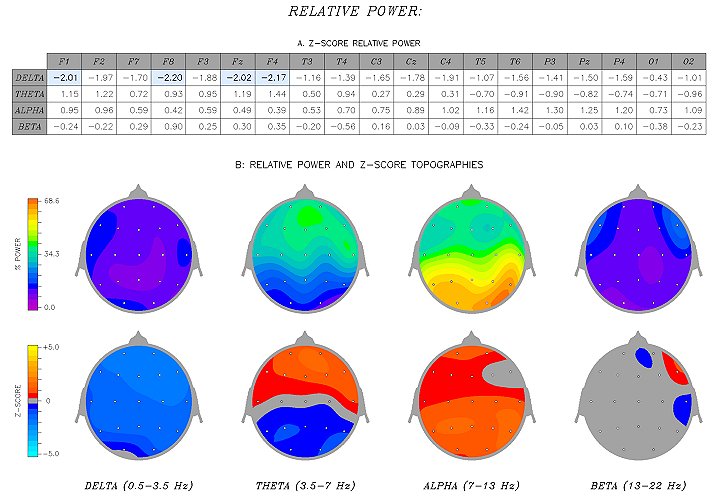
The bottom row of brain images is a database report showing excessive activity in both Delta and Theta frequencies. Note the especially excessive activity in the posterior cortex, which is a common finding with learning disabilities. Attention problems are suggested as seen in the heightened Theta in the frontal areas of the brain.
ADHD COMBINED TYPE
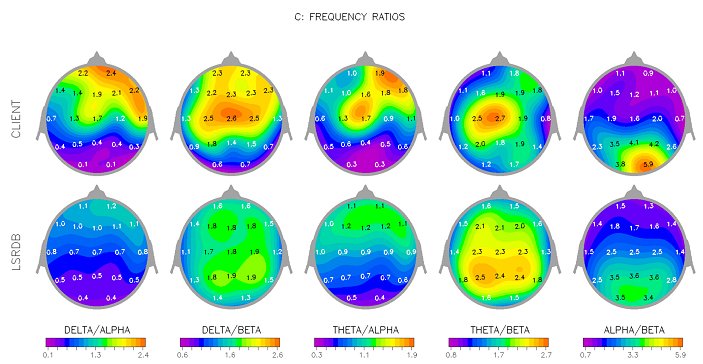
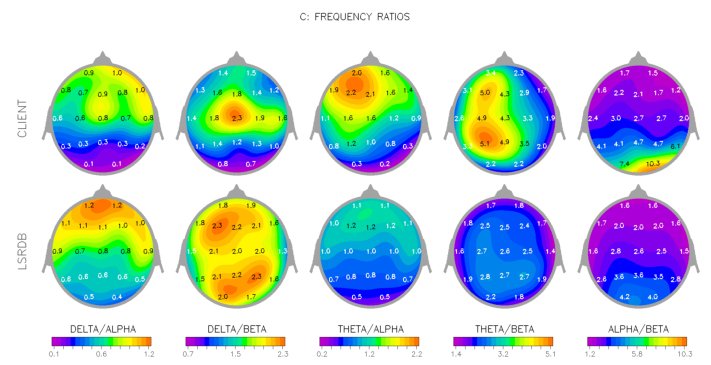
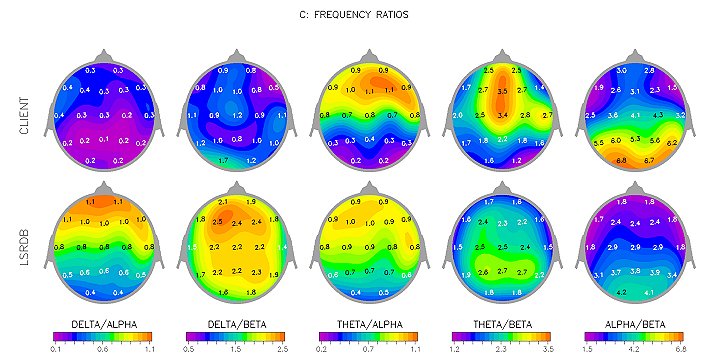
These brain images, showing frequency ratios and marked “client”, show both attention difficulty (Alpha/Beta) in the posterior area of the brain, and in the increased slowing seen in the right frontal area (Delta and Theta). Frontal slowing can be associated with a decreased capacity for impulse control.
AUTISM
[/raw]Some common features of autism are seen in these brain images. On the brain maps showing frequency ratios and marked “client”, one can see difficulties in the right frontal area (highlighted in red) as well as in the right posterior area (also in red). Such a pattern is often associated with both attention problems and with difficulty understanding social cues. Elevated Theta/Beta and Alpha/Beta ratios (client) on the left suggest problems in language delay, also a common problem in autism.
BRAIN WAVE FREQUENCIES
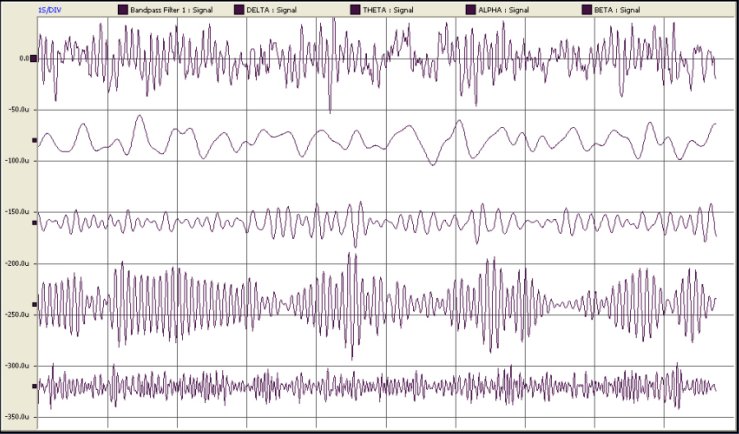
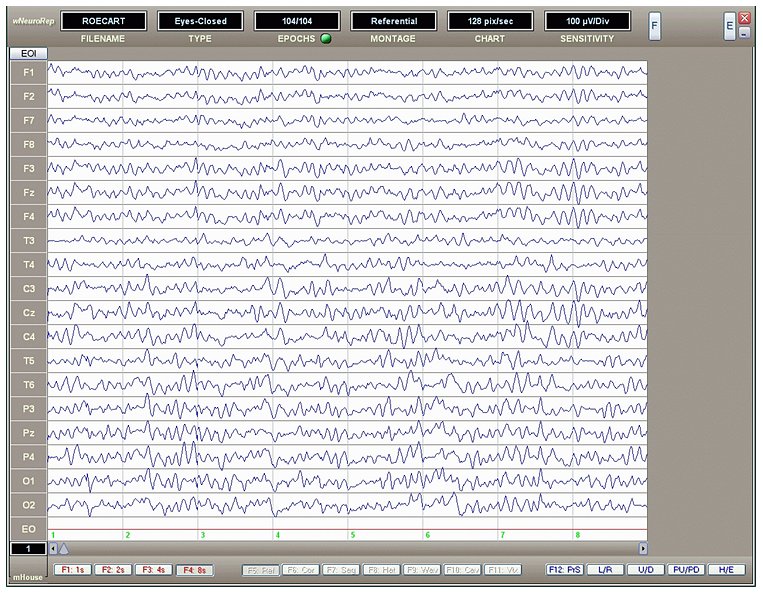
Shown above are the frequencies most commonly used to identify different types of electrical activity in the brain. The top row is “raw” EEG which is a mixture of slower, intermediate and faster frequencies. Above, in descending order, are the frequencies of Delta (.5 to 4 cycles per second); Theta (4 to 8 cycles per second; Alpha (8 to 12 cycles per second and; Beta 13 to 24 cycles per second. Above these frequencies are higher Beta and Gamma ranges which are not shown. In the case of Attention Deficit Disorder, There is usually an excessive amount of the slower frequencies relative to faster ones. This can mean that the brain has a harder time shifting into Beta activity, which is associated with working harder and getting into focus.
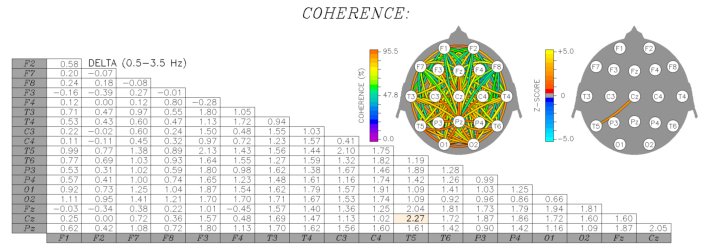


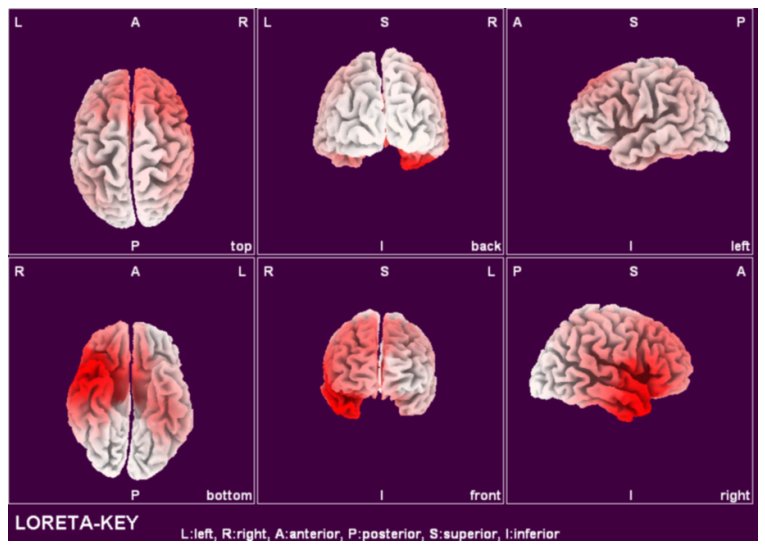
In both the Alpha and Beta frequencies, there are widespread increases in a statistical measure called “coherence”. These increases mean there is a loss of differentiated functioning between and among different areas of the brain. The result is that these areas are doing too much of the same thing. The consequence is that there is a reduction in the ability to multi-task, among other problems.
Brain Mapping
Brain Mapping helps to identify problems with attention and aids in treatment planning
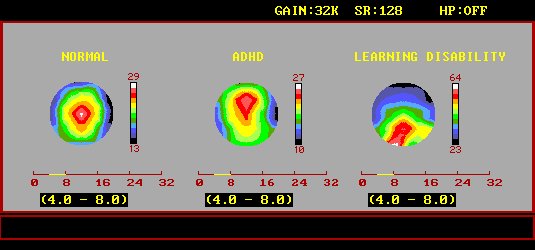
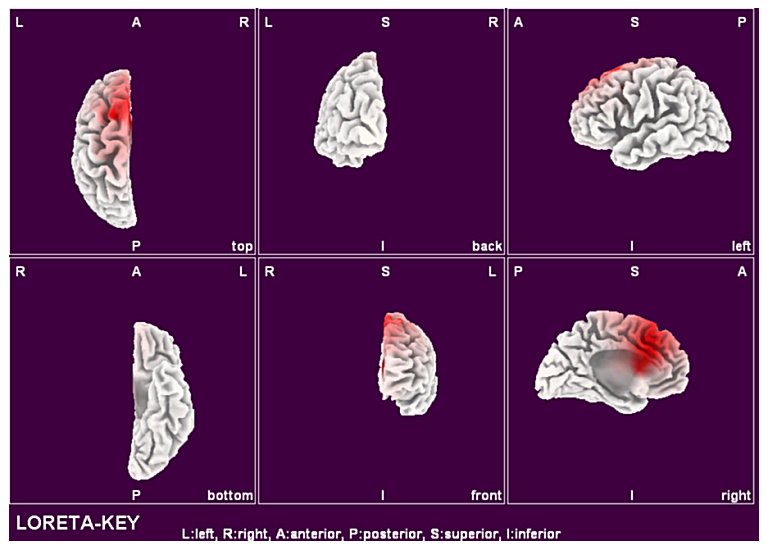
The three images shown here are brain maps of a slow brain wave called “theta,” which is generally regarded as a brainwave frequency between 4 and 8 cycles per second (also called “Hertz”). It is very common for persons with attention deficit disorder to show an unusually high amount of theta in their overall brain activity. It is thought that this is related to problems with “daydreaming” and also impulsivity. Also, it is common for theta to be seen in greater amounts over the center and front of the brain.
At the front of the brain are the “frontal lobes,” which play a key role in helping to manage attention and to manage impulses. The image which is labeled ADHD shows an area (in red) of high theta activity toward the front of the brain and was obtained with a person who was, in fact, diagnosed with an attention problem. Compare this with the image labeled NORMAL. This image also shows theta in white and red, but it is mostly positioned in the middle areas of the brain. This is where theta is usually seen in people without a clinically significant attention problem (note that we said “clinically significant,” because we all have an attention problem from time to time).
The third image is of a person diagnosed with a LEARNING DISABILITY. This is not an attention disorder, as such, but a problem with a specific learning task… like difficulty with reading or with writing. Note that the areas of theta with the Learning Disability extend toward the back of the brain and to the left. This is a pattern we often see when there is a problem with language. Some very important centers for language are located there.
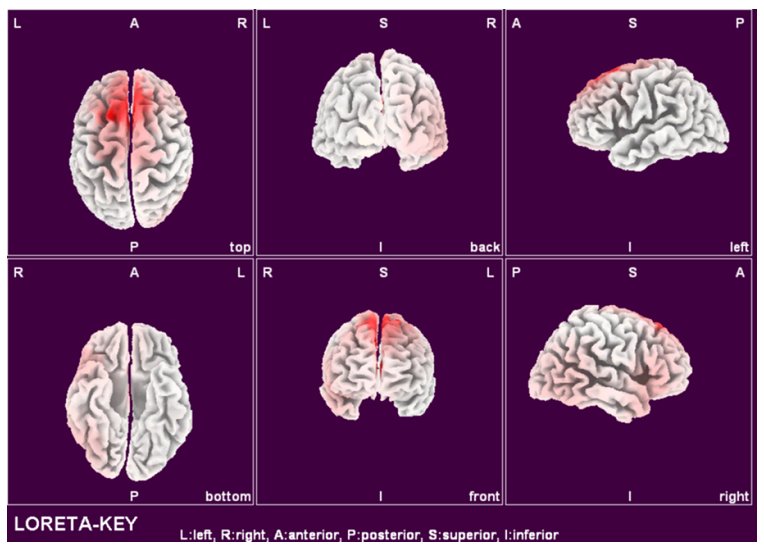
“Brain maps” are important aids in the evaluation, but they should never be used alone. Other types of diagnostic assessments must also be employed to provide a complete picture. In treatment planning, they provide important information regarding where we want to focus neurofeedback training. Moreover, along with other types of analysis involving statistical comparisons to a normative database, they can help to identify certain types of brain injuries.
Depression
One of the most common features in depression is the presence of reduced activity (i.e. increased slowing) in the left frontal lobe of the brain. In the row marked “client”, one can see indications of the increased slowing in both the Theta/Alpha and Theta/Beta ratios. Such a pattern has been shown to be related to a more negative mood.
INATTENTIVE TYPE ADHD
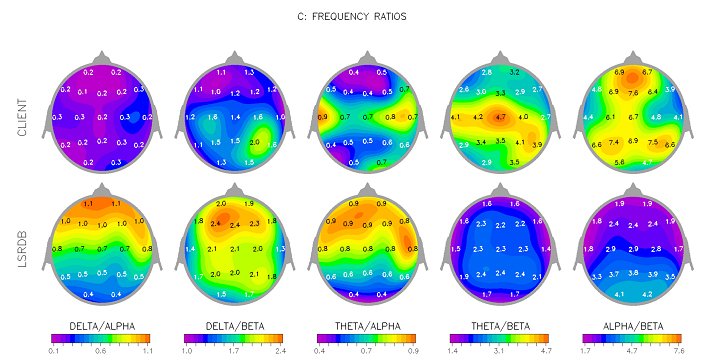
The frequency ratio brain maps marked “client” show elevated Theta/Beta and Alpha/Beta activity in posterior, central and frontal areas of the brain. An area of especially elevated activity is seen in the front and middle of the brain in the Alpha/Beta ratio. This over a brain area called the “cingulated gyrus” which is associated with being able to shift one’s focus from one thing to another. In this case, it indicates difficulty in being able to perform such a shift. The sample of raw EEG shows the occasional intrusion of slow brain wave activity into faster activity as a person periodically “fades out”.
BRAIN INJURY AND NEUROFEEDBACK
With mild to moderate traumatic brain injury, neurofeedback can provide highly significant assistance toward recovery of many brain functions often compromised because of the injury. Among the problems seen are such things as difficulty concentrating, poor memory, seizures, headaches, poor anger control, and sleep disturbances. Examination of brain activity through the use of computerized EEG (called qEEG) frequently shows an increase in the amount of slow brainwaves (especially theta) in one or more areas of the brain along with a reduction of faster brainwaves (called beta). These changes are associated with reduced efficiency of brain activity depending on the location and the extent of trauma. Neurofeedback training is directed toward assisting the patient in producing a more normalizing brain activity pattern. Through a biofeedback of EEG (i.e. “brainwave”) activity, the person learns to voluntarily either decrease theta or to increase beta. Sometimes we have the patient learning to do both at the same time. In this way, the patient begins to recover reduced brain functions through what we call “physical therapy for the brain”. Over and over again we have seen people improve their functioning in very significant and, sometimes, dramatic ways.
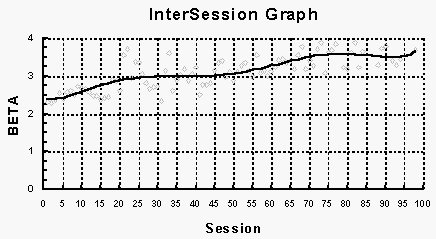
The graph seen here is the training record of a patient we worked with who had experienced a brain injury six years before therapy. The left hemisphere was injured the greatest and he was experiencing profound problems with attention and memory. Of particular importance was his explosive anger which was threatening to end his marriage. Fast brain activity in the beta range was quite low, indicating reduced cortical efficiency. This initial low beta is seen at the left on the graph. One can see a continuous rise in beta activity over the course of training which lasted about five months (“Sessions” on the graph are not days). When therapy was discontinued his beta had risen dramatically. More importantly, his symptoms had improved so much that he felt he was back to his “old self”.
Such cases offer hope for the brain-injured patient. The key element is a willingness on the part of the patient to try.
OBSESSIVE COMPULSIVE DISORDER
Obsessive Compulsive Disorder is characterized by getting stuck on certain thoughts or behaviors. The frequency ration marked “client”, shows an area of elevated Theta/Beta activity running down the middle of the brain from the front to the center (red area). This is over an area called the anterior cingulated gyrus which is associated with the being able to shift attention. In this brain image, this area appears to be malfunctioning. Interestingly, a similar pattern is often seen in both Tourette’s Disorder and Oppositional Defiant Disorder.
